pH of Soil Samples
S1
Universal Indicator: 5
pH Meter: 6.15
S2
Universal Indicator: 6
pH Meter: 6.76
S3
Universal Indicator: 3
pH Meter: 3.06
S4
Universal Indicator: 6
pH Meter: 6.39
S5
Universal Indicator: 5
pH Meter: 5.53
*****************************************************************************
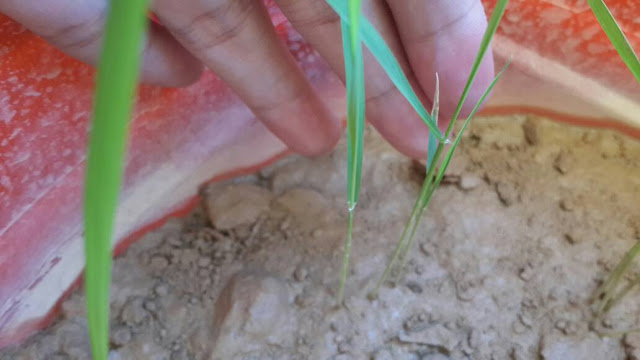
The following is the observation report for the plants planted in five different soil types after two weeks.
Mortality rate here refers to seedling mortality rate, the percentage of seedlings that fail to germinate. The deficiency symptoms refer to the deficiency of certain plant nutrients in the plants. It does not necessarily refer to the deficiency of plant nutrients in the soil sample.
S1
Average plant height: No germination
Germination rate: 0 %
Mortality rate: 100 %
Deficiency symptoms: -
Average plant height: 21.833 cm
Germination rate: 61.111 %
Mortality rate: 38.889 %
S3
Germination rate: 57.407 %
Mortality rate: 42.592 %
S4
Germination rate: 100 %
Mortality rate: 0 %
S5
Average plant height: No germination
Germination rate: 0 %
Mortality rate: 100 %
Deficiency symptoms: -
Soil Sample Macronutrient Analysis
The macronutrients of nitrogen (N), phosphorus (P), and potassium (K) are essential to plant growth and in this experiment the amount of these macronutrienrs in each soil sample were taken. The mass of the dry soil is first measured.
Table 1: The mass of dried soil (S1, S2, S3, S4).
The mass of dry soil for soil sample S5 (Mengkabong Lagoon) was not taken due to insufficient amount of the soil left to carry out for the experiment.
Afterwards, for each soil sample, 20 g of dry soil was added into a beaker and 50 ml of distilled water was mixed. For 20 minutes, the solution was mixed by hand. Afterwards, the solution is left to settle for 10 minutes before being filtered into a vacuum pump using a 0.45 µm membrane filter paper. The clear solution is then stored in a HDPE bottle, ready for macronutrient analysis using a HDCH kit. The macronutrients were analysed with code (680 Sulphate), (490 P React. PV- Phosphorus) and (355N, Nitrate HR PP). The table below shows the reading of the analysis.
Table 2: Nutrient analysis for each soil type.
“ – “ means out of detection
The macronutrients of nitrogen (N), phosphorus (P), and potassium (K) are essential to plant growth and in this experiment the amount of these macronutrienrs in each soil sample were taken. The mass of the dry soil is first measured.
Soil Type, S
|
Initial mass
of soil (g)
|
Mass of
dried soil (g)
|
S1
|
500
|
300
|
S2
|
500
|
430
|
S3
|
500
|
400
|
S4
|
500
|
390
|
The mass of dry soil for soil sample S5 (Mengkabong Lagoon) was not taken due to insufficient amount of the soil left to carry out for the experiment.
Afterwards, for each soil sample, 20 g of dry soil was added into a beaker and 50 ml of distilled water was mixed. For 20 minutes, the solution was mixed by hand. Afterwards, the solution is left to settle for 10 minutes before being filtered into a vacuum pump using a 0.45 µm membrane filter paper. The clear solution is then stored in a HDPE bottle, ready for macronutrient analysis using a HDCH kit. The macronutrients were analysed with code (680 Sulphate), (490 P React. PV- Phosphorus) and (355N, Nitrate HR PP). The table below shows the reading of the analysis.
Soil Type,
S
|
Test, T
|
Nutrient
(mg/L)
|
||
Phosphorus
|
Sulphate
|
Nitrate
|
||
S1
|
T1
|
0.76
|
128
|
1.20
|
T2
|
0.77
|
128
|
1.20
|
|
T3
|
0.77
|
128
|
1.20
|
|
Mean
|
0.77
|
128
|
1.20
|
|
S2
|
T1
|
1.99
|
27
|
5.60
|
T2
|
2.00
|
26
|
5.60
|
|
T3
|
2.01
|
26
|
5.50
|
|
Mean
|
2.00
|
26.33
|
5.57
|
|
S3
|
T1
|
1.36
|
-
|
1.6
|
T2
|
1.37
|
-
|
1.7
|
|
T3
|
1.35
|
-
|
1.6
|
|
Mean
|
1.36
|
-
|
1.63
|
|
S4
|
T1
|
1.9
|
53
|
10.7
|
T2
|
1.89
|
52
|
10.8
|
|
T3
|
1.86
|
52
|
10.8
|
|
Mean
|
1.88
|
52.33
|
10.77
|
|
“ – “ means out of detection


Food for thought:
ReplyDeleteWould it be possible the deficiency symptoms are caused because the seedlings are competing with each other for nutrient since there in a very close proximity between each other?
For seedlings they don't need much nutrient for starters.
Amount of nutrient in the soil shows that it is still sufficient though.
Please research how much padi seedings nutrient needs in their early stages to confirm.
Revise:
Please redo soil pH sample for S1, S2, S3 & S4.
The results is not valid too different.
How does this group define 'mortality rate'?
Don't forget to dug out some seedlings tomorrow (12th May 2017) to measure the length of the whole seedlings (root & shoot), Root length only and shoot length only.
I am not convince with the type of soil texture of this group.
Please double check the jar test results with sieve analysis test.